Key Takeaways
- Most SLA reporting happens after a breach; asset-level data enables proactive risk detection instead.
- MTBF, MTTR, and uptime percentage are the three metrics that map directly to SLA risk.
- Hardware uptime and software uptime are distinct — a contract can be breached at either layer.
- Setting internal alert thresholds tighter than contractual limits creates a margin to recover before a breach.
- Predictive signals include aging hardware, repeat failures, and idle or underused assets.
- Self-service replacement hardware shortens MTTR by removing the need for a staffed desk during swaps.
If you’re accountable for service level agreement (SLA) compliance, you already know the uncomfortable truth about most SLA reporting: it happens after the fact. A device fails, a service goes down, a ticket ages past its promised resolution window, and only then does anyone reach for the data to explain what went wrong. By that point, the breach has already happened, and the conversation is about penalties, not prevention.
IT asset management data supports SLA (service level agreement) compliance by giving teams visibility into asset availability, uptime, and failure history. This allows them to report accurately against contractual commitments and identify at-risk hardware before it causes a breach, rather than only reacting after an outage occurs.
That shift, from reporting after the fact to spotting risk early, is the whole point of connecting asset-level data to SLA management. This piece covers how availability and uptime tracking work, which metrics matter, how to report on them credibly, and how to turn that data into an early-warning system instead of a post-mortem.
Why do SLAs Depend on Asset-Level Data?
An SLA is a promise about a service outcome:
- A help desk resolves incidents within a set window
- A kiosk stays available for a set percentage of the month
- A replacement device reaches an employee on time.
Behind every one of those promises sits hardware: laptops, network gear, kiosks, lockers, servers. When the hardware underneath a service degrades, the service commitment is the first thing at risk.
The problem is that most SLA discussions live at the service layer, while the failures that break them live at the asset layer. You can watch a service dashboard turn red without knowing which asset caused it or whether the same unit has failed before. Without asset-level data, SLA management stays reactive by design. You can only respond to what you already see, and by then the clock has usually run out.
Service management frameworks make this dependency explicit. ITIL service management treats service level management as an ongoing practice of defining, measuring, and reviewing targets against real performance, and ISO/IEC 20000-1 sets requirements for managing service levels within a documented service management system. Both assume you hold accurate and current data about the components delivering the service. And asset management is where that data comes from.
The Link Between Hardware Health and Service Commitments
Think of it as a chain: a contractual commitment sits at the top, the services that satisfy it sit below, and the assets that run those services sit at the bottom. A weakness travels upward: a failing power supply becomes a device outage, which becomes a missed availability target, which becomes a breach.
Asset-level data lets you read the chain the other way: start from a service target at risk and trace down to the assets most likely to cause the miss. A good IT asset management program keeps that chain visible by tying asset records to the services they support, so that hardware health and service commitments aren’t two separate conversations.
For how mature programs structure this, see our guide to IT asset management best practices.
What Asset Availability and Uptime Tracking Actually Measures?
“Availability” and “uptime” get used loosely, so it’s worth being precise. Availability is whether an asset is ready to do its job when it’s needed; uptime is the measured proportion of time it actually was. The distinction matters because contracts are written against measured uptime over a defined period (a month, a quarter…) not a general sense that things are “mostly working.”
It’s also worth separating two kinds of uptime that often get merged.
- Hardware uptime describes a physical unit (a kiosk, a locker bank, a server) being powered, online, and able to perform its function.
- Software or service uptime describes a platform or application being reachable and responsive.
A dispensing kiosk can be powered and online while the software service that authorizes a pickup is unreachable. In essence, accurate SLA reporting accounts for both because a contract promising “the service is available” can be breached at either layer.
Key Metrics: MTBF, MTTR, and Uptime Percentage
Three metrics do most of the work in availability reporting. Defined correctly, they map directly to SLA risk.
| Metric |
Definition |
What it tells you |
How it maps to SLA risk |
| MTBF (Mean Time Between Failures) |
The average operating time between one failure and the next for a repairable asset. |
How reliable is an asset while it’s running? |
A falling MTBF signals more frequent failures: an early sign that an asset is heading toward a breach-causing outage. |
| MTTR (Mean Time To Repair or Restore) |
The average time to detect, fix, and return an asset to service after a failure. |
How quickly you recover once something breaks? |
A rising MTTR pushes you toward missed resolution windows even if failures stay flat. |
| Uptime % |
The proportion of scheduled time an asset was available and functioning, over a fixed period. |
The headline availability figure most SLAs are measured against. |
Usually, the number in the contract: track it continuously so that you know your margin before period end. |
Watch all three together: MTBF and MTTR are the inputs, uptime is the outcome, and you can see a breach forming before it lands.
One caution on percentages. Uptime figures only mean something against a clearly defined denominator such as scheduled hours, whether planned maintenance is excluded, and what counts as “down.” A “99.9%” claim with no defined measurement window isn’t something you can report against, so pin down the definition before committing to a number in a contract or a dashboard.
Reporting on Asset Compliance With SLAs
Collecting metrics is the easy part. The harder part is turning them into reporting a customer, an auditor, or your own leadership will trust. SLA reporting has to answer three questions cleanly: what did we promise, what did we deliver, and where is the gap. And asset data lets you answer the second with evidence instead of assertion. Pull it from a single, current source of asset truth rather than spreadsheets stitched together after the fact, so that each reported target traces to the assets behind it and can be defended down to the device that produced it.
Building Dashboards Stakeholders Can Trust
A dashboard earns trust when readers can’t easily poke holes in it:
- Show the target and the actual side by side. A number next to its commitment shows margin at a glance; a number in isolation invites argument.
- Make the data source and time window explicit, so that no one has to guess what period the figures cover or whether planned maintenance is in or out.
- Trace service metrics down to assets. Letting a reader move from a service-level figure to the hardware behind it is the difference between a report that claims and one that demonstrates.
- Report trends, not just snapshots. A single month at 99.5% looks fine; three months trending down from 99.9% is a warning.
Reliable dashboards depend on reliable inputs, which is why a complete, accurate asset inventory is the foundation of everything downstream.
Check out our article on IT asset management benefits for IT teams that covers how the above inventory pays off.
From Reactive to Proactive: Catching Risk Before a Breach
Everything so far describes measuring what happened. The real value of asset data shows up when you use it to see what’s about to happen. Reactive SLA management waits for a breach and explains it; proactive SLA management reads the early signals already sitting in the data most teams collect and acts while there’s still time. In practice, proactive SLA management follows four connected stages:
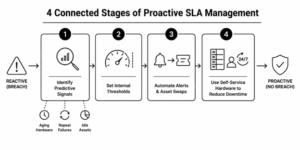
Stage 1: Identifying Predictive Signals: Aging Hardware, Repeat Failures, and Idle Assets
The first stage is recognising the patterns that often precede SLA-threatening failures. A handful of signals consistently indicate rising operational risk:
- Aging hardware. Assets past their expected service life fail more often and take longer to repair. Age alone isn’t a verdict, but a fleet skewing old carries rising failure risk that erodes uptime.
- Repeat failures. An asset that has failed several times is far more likely to fail again. Repeat offenders quietly drag down MTBF and are prime candidates for replacement before they take a service target with them.
- Idle or underused assets. Unused assets can mask developing faults that only surface under load and distort capacity planning. Knowing what’s genuinely available and not just what exists keeps your availability math honest.
These signals don’t require exotic tooling, just asset records that are current, connected to failure history, and reviewed on a rhythm rather than only after something breaks. Doing that at enterprise scale, across many sites, is a challenge in its own right; our piece on enterprise ITAM challenges and solutions goes deeper.
Stage 2: Setting Internal Thresholds Ahead of Contractual Limits
The next practical move in proactive SLA management is to set your internal alert thresholds tighter than your contractual limits. If a contract commits you to 99.5% monthly uptime, set an internal trigger at, say, 99.7%, so that when availability crosses it, you still have room in the month to recover before the contractual line is crossed.
The same logic applies to MTTR: if your resolution commitment is four hours, escalate internally at three. These thresholds turn a hard contractual cliff into a warning zone, a margin of safety you manage inside, so that the customer never sees the edge.
Stage 3: Automating Alerts and Asset Swaps
The next stage is automated alerting. When an asset crosses an internal threshold: availability dipping, MTTR climbing, a repeat failure logged- the system should raise an alert and, where possible, open a ticket in your IT service management (ITSM) tool automatically. Routing asset events straight into a platform like ServiceNow or Remedy means the response starts on its own, with the failing asset already identified.
From there, the response is often a swap: pull the at-risk unit and put a healthy one in its place before the failing one causes an outage. This is where “we knew” turns into “we acted” and where the mechanics of replacement start to matter for your numbers.
Stage 4: Using Self-Service Hardware to Reduce Downtime During Replacement
Replacement itself creates downtime risk: if swapping a failing device means an employee waits at a staffed desk, or the whole unit goes offline during a manual handoff, the replacement can cost you the very availability you were trying to protect.
Self-service dispensing hardware changes that math. When employees can collect a replacement from a locker or kiosk 24/7:no desk, no queue, no handoff, a swap doesn’t have to wait for business hours or a free technician. Modular, field-reconfigurable hardware also means a single failing component can often be addressed without taking the whole unit out of service. Both effects shorten the window during which a replacement drags on availability, keeping MTTR down and protecting the uptime your SLA is measured against.
Putting It Together: An SLA-Ready ITAM Reporting Framework
An ITAM program built to protect SLAs works in a repeatable loop:
- Map assets to commitments: Connect every service-level target to the assets that deliver it.
- Measure the right metrics: Track MTBF, MTTR, and uptime against defined windows, hardware and software accounted for separately.
- Report with traceability: Build dashboards that show target versus actual and trace every figure down to the assets behind it.
- Watch the predictive signals: Review aging hardware, repeat failures, and idle assets on a rhythm, not only after a breach.
- Set internal thresholds inside your contractual limits: Give yourself a margin to recover before the line is crossed.
- Automate the response. Route asset events into your ITSM tool and make replacements fast and low-friction.
Run that loop continuously, and SLA management stops being a monthly reckoning and becomes a steady practice of watching the margin.
How Signifi Can Help You Protect Your SLAs
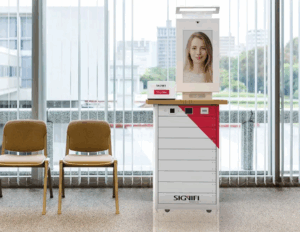
Understanding this framework is one thing; running it across a distributed workforce, at many sites, with hardware you can actually monitor, is another. The challenge isn’t the concept. It’s having a physical asset layer that reports its own status and a replacement process that doesn’t cost you the uptime you’re defending.
Signifi builds both halves of that system. Our ITAM hardware, the Tech Express Desk (TED) kiosk, HD Smart Lockers, and Security Key Dispenser, is monitored equipment: each unit reports real-time status and availability data to SignifiVISION™, the cloud platform that runs it. That gives you the asset-level uptime and health data that SLA reporting depends on, drawn straight from the hardware rather than reconstructed after an outage. SignifiVISION integrates with ITSM systems like ServiceNow and Remedy through RESTful APIs, so that asset events open tickets automatically.
Because Signifi designs, engineers, and builds this hardware in-house, the units are configurable, field-reconfigurable without full hardware swaps, and ADA/508-compliant: one system rather than a software tool bolted onto someone else’s equipment. And because collection is self-service and available 24/7, replacing an at-risk device doesn’t wait on a staffed desk, keeping downtime short during exactly the swaps that protect your numbers. Contact us to learn how our IT asset management solutions can give your team the data it needs to hit its SLAs and keep them.
Frequently Asked Questions
How does IT asset management data help with SLA compliance?
It gives you visibility into asset availability, uptime, and failure history, so you can report accurately against contractual commitments and spot hardware trending toward failure before it causes a breach. Without asset-level data, SLA management can only react after a target has already been missed.
What’s the difference between MTBF and MTTR?
MTBF (Mean Time Between Failures) is the average operating time between one failure and the next for a repairable asset. In other words, how reliable is it while running? MTTR (Mean Time To Repair or Restore) is the average time to fix it and return it to service after a failure. In other words, how fast you recover? MTBF is how often things break; MTTR is how quickly you bounce back.
How do you track asset availability for an SLA?
Measure uptime as the proportion of scheduled time an asset was available over a defined period, against a clear definition of what counts as “down.” Tie each service-level target to the assets that deliver it, and report the measured figure against the committed target continuously, not only at period end.
How can asset data catch an SLA breach before it happens?
By reading predictive signals: aging hardware, repeat failures, and idle assets, and setting internal alert thresholds tighter than your contractual limits, you ensure that a crossed trigger still leaves room to recover before the contractual line is breached.
What does “uptime” mean for physical hardware versus software?
Hardware uptime is a physical unit being powered, online, and able to perform its function. Software or service uptime is a platform being reachable and responsive. A device can be powered on while the service behind it is unavailable, so accurate SLA reporting accounts for both layers.
How does self-service hardware reduce downtime during device replacement?
When employees can collect a replacement from a locker or kiosk 24/7- no staffed desk, queue, or handoff- a swap doesn’t have to wait for business hours or a free technician. That shortens the window during which a replacement affects availability, keeping MTTR down and protecting the uptime your SLA is measured against.